Preface
"establishedness - a broad distribution can be an indicator of quality" I wrote something similar to this in the draft of my paper and then stopped for a second. - That's a really bold claim with no backup and nevertheless this feels so true that I didn't even think it could be wrong. A quick google search backed me up... But it was just comments over comments and many opinion blogposts which said that more popular packages are always of higher quality. But this is not good enough to be quoted in a paper, so I started to dive headfirst into some data analysis.
What is quality or even popularity
For this analysis I will take the definitions from npms.io/about, just because they offer an awesome API which already included the quality data and I didn't have the time and resources to run some code analysis on nearly two million packages.
Two million packages...
Yeah, NPM is big and when I started, I just thought "hey, let's take the package registry you know best and which is public" - totally ignoring what that meant and the implications that would follow.
Getting a list of all packages
NPM doesn't have a simple API which you can call and just say "please give me all package names". At least not officially. StackOverflow to the Rescue! In this thread about how to list all public packages in the npm registry Mark Amery mentioned that the CouchDB of NPM is open to the public, so we can just use curl https://replicate.npmjs.com/_all_docs to download all docs in JSON format.
So a quick...
bashcurl https://replicate.npmjs.com/_all_docs > npm.json
  % Total    % Received % Xferd  Average Speed   Time    Time     Time  Current
                                 Dload  Upload   Total   Spent    Left  Speed
100  197M    0  197M    0     0  15642      0 --:--:--  3:40:56 --:--:-- 45857
I fully expected NPM to just block me at some point, but props to them for allowing me to download all of this (albeit at a snail's pace)
... and about three hours and forty minutes of downloading later I had all that data in my hand in JSON format. Also I now saw that I was talking about 1.890.051 packages.
In case you're interested: Here are the first couple lines of that npm.json.
json{
  "total_rows": 1890052,
  "offset": 0,
  "rows": [
    {
      "id": "-",
      "key": "-",
      "value": { "rev": "4-85c3fa20acfaf5810bcd5c07e6bc0d70" }
    },
    {
      "id": "--file--1",
      "key": "--file--1",
      "value": { "rev": "2-b08af162ffd0b4940dc119d473b7a3ea" }
    },
    {
      "id": "--hiljson",
      "key": "--hiljson",
      "value": { "rev": "14-6aa166d0e7ece44ae8b455d82c973232" }
    },
    {
      "id": "-8080",
      "key": "-8080",
      "value": { "rev": "1-46cb32ff42d398c21ec674137929910f" }
    },
    {
      "id": "-8888",
      "key": "-8888",
      "value": { "rev": "1-9644f8717b99309303afebf88e8be180" }
    },
    {
      "id": "-blanc-server-project",
      "key": "-blanc-server-project",
      "value": { "rev": "3-4a24e867845a03a2fb51be76d811f393" }
    },
    {
      "id": "-ethomson-test-package",
      "key": "-ethomson-test-package",
      "value": { "rev": "2-ef75e5ff46970ad60a99699a5c386181" }
    },
    { "...": "More of this for about 1.9 million lines" }
  ]
}
Making more of it
At this point in time I had all package names (although not yet extracted), but how would I make a quality check? My first thought was to just check wether or not a README.md exists, but this is unreliable and sometimes packages only have a "technically this is a file called README"-Readme. Also I didn't find a quick way to check that data on all packages.
In comes npms.io
npms.io is "a better and open source search for node packages" created by André Cruz (@satazor) and André Duarte (@atduarte) and the biggest difference for me was that they have a really well documented API for searching packages. In my case I just needed to pump each package into their API and save the result. To reduce roundtrips and server load, I bundled as much as possible into https://api.npms.io/v2/package/mget requests.
One of the great features of NPMS is, that it includes a quality and popularity metric for each package, so you can be more confident when choosing a package (you can also look at maintenance records and an overall score, but those weren't relevant to me.)
Loading metadata of all packages
By the way, nodejs is great for cli work - in case you missed it
To load the metadata of all 1.9 million packages I've build a small node script.
All this does, is downloading the metadata 250 packages at a time with 25 parallel connections from npms.io and saving the result to a CSV.
To keep old data when something goes wrong, I also added that each execution only fetches 100k packages (learned this the hard way when I saw that npms.io throws on packages starting with "_", but npm.com contains "_design/app" and "_design/scratch" at position 530,063 in my npm.json).
jsimport { fetch } from "undici";
import { readFile } from "fs/promises";
import { writeToPath } from "@fast-CSV/format";

// Increment this with each run
const PAGE = 0;

// Chunking done so if a connection aborts not everything is lost
const CHUNK_SIZE = 100_000;
const START_POINT = CHUNK_SIZE * PAGE;

// Use parallel connections to speedup download
const PARALLEL_COUNT = 25;
const LOAD_SIZE = 250;

const getPackages = async (path) => {
  const file = await readFile(path);
  return JSON.parse(file).rows;
};

const loadPackages = async (packages) => {
  const result = await fetch("https://api.npms.io/v2/package/mget", {
    body: JSON.stringify(
      packages
        .map((package_meta) => package_meta.key)
        .filter((key) => !key.startsWith("_"))
    ),
    headers: {
      "Content-Type": "application/json",
      Accept: "application/json",
    },
    method: "POST",
  });
  return await result.json();
};

const writeOutput = (path, data) => {
  const convertedRows = [
    [
      "name",
      "analyzedAt",
      "popularityScore",
      "qualityScore",
      "maintenanceScore",
      "overallScore",
    ],
    ...data.map((entry) => [
      entry.name,
      entry.analyzedAt,
      entry.popularity,
      entry.quality,
      entry.maintenance,
      entry.overall,
    ]),
  ];

  return new Promise((resolve, reject) =>
    writeToPath(path, convertedRows).on("finish", resolve).on("error", reject)
  );
};

const transformNpmsMeta = async (npmsMeta) => {
  return Object.entries(npmsMeta).map(([name, meta]) => ({
    name,
    analyzedAt: meta.analyzedAt,
    popularity: meta.score.detail.popularity,
    quality: meta.score.detail.quality,
    maintenance: meta.score.detail.maintenance,
    overall: meta.score.final,
  }));
};

const main = async () => {
  const npmMeta = await getPackages("./npm.json");

  const end = Math.min(npmMeta.length, START_POINT + CHUNK_SIZE);

  const analyzedData = [];
  for (let i = START_POINT; i < end; i += LOAD_SIZE * PARALLEL_COUNT) {
    const promises = [];
    for (let j = 0; j < PARALLEL_COUNT && i + j * LOAD_SIZE < end; j++) {
      const parStart = i + j * LOAD_SIZE;
      promises.push(
        new Promise(async (res) => {
          console.log(`Loading ${parStart} of ${end}`);
          const npmsMeta = await loadPackages(
            npmMeta.slice(parStart, parStart + LOAD_SIZE)
          );
          analyzedData.push(...(await transformNpmsMeta(npmsMeta)));
          console.log(`Loading ${parStart} of ${end} finished`);
          res();
        })
      );
    }
    await Promise.all(promises);
  }
  console.log(
    `Finished loading ${START_POINT} - ${end}. (${
      npmMeta.length - end
    } remaining)`
  );
  writeOutput(
    `./npm-${START_POINT}-${START_POINT + CHUNK_SIZE - 1}.csv`,
    analyzedData
  );
};

main();
After scraping all packages from npms.io, I just combined the CSVs by hand (which was reasonably quick) and now I have one big CSV which is easy to use. Or so I thought...
Even more problems
In case you don't know, in germany we write floating point numbers with a "," as the divider instead of a ".". So PI is "3,14159265358979323" and the number of cookies the cookie monster ate on "The Furchester Hotel" is written as 1.500 (source).
Now I thought that I could just pump that data into Excel or Google Sheets and plot the result - but I misjudged those two. Google Sheets wasn't happy with the size of my data. After uploading the 200MB CSV, it just complained that the input was too large (thanks for letting me upload all of that first). Excel was an even worse story. It doesn't like that many rows and just stopped importing after 1.1 million rows. But even if you reduce it down for excel, it doesn't like "." as a decimal divider. Even disabling using the system delimiter and setting it manually didn't help when loading data.
The solution
Adding one more step of preprocessing, where the data is clustered further, is done, so we only have a couple thousand entries in excel.
For this a second node script was written:
jsimport { parseFile, writeToPath } from "fast-CSV";

const loadData = (path) => {
  const result = [];
  return new Promise((res) => {
    parseFile(path)
      .on("data", (row) => result.push(row))
      .on("end", (_) => res(result));
  });
};

const compressData = (data, chunkSize) => {
  const res = [];
  data = data.sort((a, b) => a.popularityScore - b.popularityScore);
  for (let chunkStart = 0; chunkStart < 1; chunkStart += chunkSize) {
    const nextChunkStartIndex = data.findIndex(
      (entry) => entry.popularityScore >= chunkStart + chunkSize
    );
    const chunk = data.slice(0, nextChunkStartIndex);
    data = data.slice(nextChunkStartIndex);

    if (chunk.length) {
      const total = {
        popularityScore: 0,
        qualityScore: 0,
        maintenanceScore: 0,
        overallScore: 0,
      };
      for (const dat of chunk) {
        total.popularityScore += dat.popularityScore;
        total.qualityScore += dat.qualityScore;
        total.maintenanceScore += dat.maintenanceScore;
        total.overallScore += dat.overallScore;
      }
      res.push({
        popularityScore: total.popularityScore / chunk.length,
        qualityScore: total.qualityScore / chunk.length,
        maintenanceScore: total.maintenanceScore / chunk.length,
        overallScore: total.overallScore / chunk.length,
      });
    }
  }
  return res;
};

const main = async () => {
  console.log("Loading Data");
  const CSVData = await loadData("npm-combined-no_header.csv");
  console.log("Converting Data");
  const data = CSVData.map(
    ([
      name,
      analyzedAt,
      popularityScore,
      qualityScore,
      maintenanceScore,
      overallScore,
    ]) => ({
      name,
      analyzedAt: new Date(analyzedAt),
      popularityScore: parseFloat(popularityScore),
      qualityScore: parseFloat(qualityScore),
      maintenanceScore: parseFloat(maintenanceScore),
      overallScore: parseFloat(overallScore),
    })
  );
  console.log("compress data");
  const compressed = compressData(data, 0.0001);
  console.log(data.length, compressed.length);
  writeToPath("compressed.csv", compressed, {
    delimiter: "\t",
    headers: true,
  });
};

main();
Yes, I know that I now had successfully downloaded JSON, so I could download more JSON, to make it into CSV, so I can manually stitch together some CSVs, so I can load them again and parse them to JS(ON), so it will be written again as CSV to disk. If I did it again, I would do it differently, but now I already had the previous data, so let's keep it.
So what does this script do?
In the end it just takes the data from the previous step and clusters all values in 0.0001 popularity clusters. To visualize this, imagine the following data:
| X | Y |
|---|---|
| 0 | 5 |
| 1 | 4 |
| 2 | 6 |
| 3 | 3 |
| 5 | 1 |
| 6 | 9 |
If we now create clusters of size 3, we get the following clusters:
+-----------------+
|0 1 2 3 _ 5 6 _ _|
+-----------------+
        |
        V
+-----+-----+-----+
|0 1 2|3 _ 5|6 _ _|
+-----+-----+-----+
| X | Y |
|---|---|
| 0 | 5 |
| 1 | 4 |
| 2 | 6 |
| X | Y |
|---|---|
| 3 | 3 |
| 5 | 1 |
| X | Y |
|---|---|
| 6 | 9 |
Now each cluster gets reduced to a single value. For this the median of both columns get calculated:
| X | Y |
|---|---|
| (0+1+2)/3 = 1 | (5+4+6)/3 = 5 |
| (3+5)/2 = 4 | (3+1)/2 = 2 |
| 6/1 = 6 | 9/1 = 9 |
If we now do the same for all data and plot the result in excel, we get the following graph:
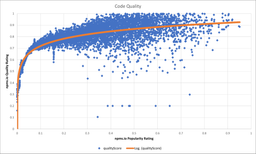
I've added a logarithmic trendline to better visualize what's happening here.
Result
In my opinion the data shows what I expected when I started doing this: popularity is a strong indicator for quality (at least as long as you agree with the quality factors of npms.io). It also clearly describes that (like you would expect) high usage is not a guarantee for high quality. We can clearly see many dots falling way below the curve and the smaller we make the clusters, the more clear this becomes.
But this data shows also something I didn't expect! Putting some dots aside and also ignore the nearly unused packages, overall packages on npm have a fairly high code quality which I think is really great!
If you think stuff like this is cool and you either want to reproduce it yourself, or you think that npms.io is awesome, remember to not take open source work for granted. Maybe you can find a couple of dollars or some minutes of your time to spare and do it like me and buy your open source contributors a coffee or contribute back in other ways. It shows appreciation and also helps to compensate for higher costs you might have created especially when doing scraping projects like these.
What is this
I'm neither a data scientists nor a statistician. Also this work is not done as thoroughly as it's possible, since a fairly fundamental result was "good enough" for my usecase. Nevertheless the results align with my experience and I wanted to share what I've found.
Also this post does not mean that you shouldn't use smaller libraries! It just means that popularity can be an indicator for good packages.