Updates
This post was first written for an old version of the discussed site.
Since then, "the native web" made some significant changes after I shared my concerns in private with them. I will discuss these changes on the Update Log below.
They were always fast in their responses and really professional, so please read through the updates, as I try to provide some insights on what happened and hope that we all can learn something from it.
Original Post
I know, these are many comments upfront, but they are important to me, so please read them.
The solution I will create here is not identical to the original. This is mostly because of time constraints (I only spent like one evening on it) and because I have to download every used asset manually.
For this reason I only support modern versions of Chrome, don't support web embeds like Twitter and probably breaks in other ways too.
One last note:
After creating the reimplementation and before writing this blog post I've gotten in contact with Golo Roden (founder and CTO of "the native web") so I don't get anything fundamentally wrong and I also believe that this should be common courtesy.
This doesn't mean that Golo had a direct say on the content of this post.
Intro
Huh, that was a long read before the post even started, but now we can begin.
This blog post belongs into my starting series "oops, I opened up lighthouse and now I want to see if I can do it faster" which already has one (1) entry (Opinion on the RKI COVID19 dashboard). Like back then I opened up the page of a site I already liked and wanted to see if I can see some obvious performance pitfalls and whether or not I can improve only on the performance aspect.
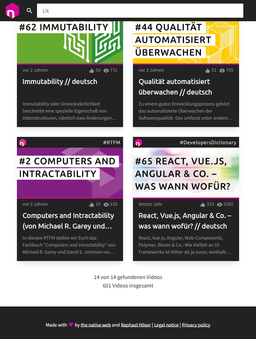
This time "the native web" launched a custom video search web app for their YouTube channel under https://app.thenativeweb.io.
Just one comment on the design: I love it.
It's simple, it does its job and I learned something from it.
What is the state of things?
Scaling blur
Here is a before and after video. Look at the text rendering while the element scales up and down (Sadly compression made this one hard to see, look at it in the original).
This small thing bugged me a little and so I opened up dev tools to see whether or not I could fix that (first mistake of mine).
As you can see, I was able to fix it. And it was only one line of CSS:
The will-change property can get expensive really quickly, so don't put it on all elements. In this case I think it's fine, because we have normally only a couple of dozen elements on the page.
csswill-change: transform;
Putting that on the container of each item tells the browser that we will change the transform property, for example with transitions or animations. This leads to the browser putting that element on a separate rendering layer which avoids many issues especially with the subpixel rendering of text. This results in the text being slightly blurry at all times, because subpixel rendering doesn't work as well.
Now that the DevTools are open...
At this point I had the DevTools open and every time I have that, I normally look at two things right away.
Page Weight
The total page weight (here excluding images and fonts, I will get to that later).

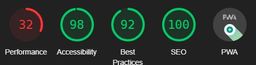
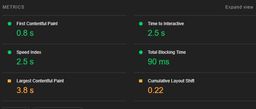
Lighthouse Score
Update:
At a later point in time during the first update, I saw that my local tests (where these screenshots come from) yielded significantly lower results than third party services like PageSpeed Insights (77 instead of ~50 for performance on 2022-10-20).
I don't know the reason for this, since this page still shows reproducible 100s. A test with a twitter tweet is also within margin of error.
Without testing I suspect a weird route to the servers from my place.
As always, the lighthouse metrics are recorded with the default "mobile" preset.
These are (performance aside) actually pretty good.
A11y 98 comes from the text "x von y gefundenen Videos", which has the color #999999 on white (which has the color contrast of 2.84:1 to the white background), but AA-contrast requires at least 4.5:1, so the color would need to be #767676 or darker. This is acceptable in my opinion, since it's not a really important info anyway.
The Best Practices 92 comes from the source maps missing (which is absolutely fine in a production deployment) and all images being displayed with incorrect aspect ratios (this would benefit from fixing, but it's barely noticeable even when you know).
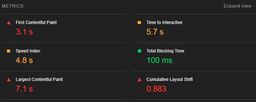
Now to the big point... 32 on performance... That is not good, so let's take a closer look.
Performance Scores in Detail

LCP and CLS
The Largest Contentful Paint (LCP) is quite bad, but in relation to the First Contentful Paint (FCP) it's not that bad. Especially because this paint is related to a thumbnail rendering, which is quite slow for other reasons (spoiler alert: images are a tradeoff on this page, which I'd have probably done too).
Cumulative Layout Shift (CLS) on the other hand can probably be completely ignored here. This metric is "bad", because the page has very few elements and a footer that jumps off screen once the videos load. If this came across my desk at work and someone would say "working around that would mean a bunch of code that makes everything else slow", I'd give it a pass. This metric is sometimes a little hard to hit with Jamstack pages where all the main content is loaded on the client after an App Shell is already rendered. One possible solution for this would be to give the footer a position: sticky; bottom: 0;, but that would eat space from the videos and therefore I think the tradeoff for an increased CLS is valid.
FCP
And now to the big boy in town: First Contentful Paint (FCP).
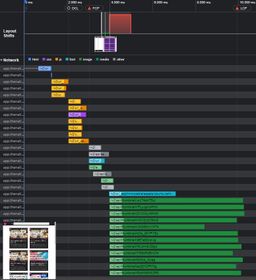
To get a better insight, let's make a "Performance Insights" run for the page:
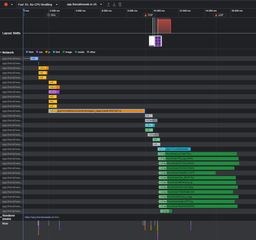
As you can see, the HTML and some of the JS is already parsed and executed in the first two seconds of the request. At that point also the "DOM Content Loaded" (DCL) event is fired, but at that point in time the screen is still blank.
Now some more JS is downloading and the biggest part takes the big horizontal line of _page.svelte-43331ef1.js (from now on known as page.svelte). That single file takes nearly 7.5 seconds to load, because it alone is 1.2 MB in size (as an unfair comparison, my reimplementation is 35k excluding images and fonts and this blog post is 207kb including images, excluding videos). This means that the JS bundle is bigger than the 12 images loaded as thumbnails for the first videos combined.
One small note on FCP: the dev tools don't register the app shell as FCP (and that renders after ~3 seconds) so FCP is marked as when the page.svelte finishes loading.
Also I don't know why, but in my traces the API for the first 12 videos is requested twice and since it's not cached, both requests take about 1 second to complete. And after those complete, the thumbnails start to load.
One note regarding the server:
Often when I do these things I see the server times as a huge factor when loading data (e.g. in the RKI post the longest time my implementation is waiting on a response by the server). But in this case the server is really fast enough for the usecase. Sub-second roundtrip times for search requests (normally ~750-800ms on Fast 3G) is significantly faster than I expected.
And the real issue is...
JavaScript.
Not that it exists, but that it's required for the FCP and that there is so much of it, that it postpones rendering for 7.5 seconds.
Trying to fix it:
Now that I've spent some time looking at the issue, I wanted to see whether or not I could create a more performant implementation of this (and to see how easy it was to implement some quirks like endless scrollers in Lit).
Loading the data
The original application exposes an API with json data for all videos, that also allows filtering, limiting and pagination. This comes in quite handy and so I tried requesting it from my reimplementation, but...

I personally believe that most APIs should be accessible via CORS, especially when they are openly accessible anyways (if a login is required, it's another discussion).
... the original API doesn't provide CORS headers.
CORS would allow my reimplementation to access the content from the other domain directly, but this way it's not possible, except you do a little well known trick:
CORS Proxy
CORS proxies inject those headers for you. This works, because CORS checks only happen in the browser and any server side application can just ignore them / they don't apply. So what I did is essentially requesting a different service, which in turn requested data from the original API and routed the response back to me with CORS headers.
There are many CORS proxies out there and some are even free and you can also host them yourselve. For simplicity I just used allorigins.win because it's free and was the first working one I've found.
Remember: be a nice player on the web, especially when you use free APIs that are not yours!
Try to decrease load you create on other servers and if you do need to scrape many things, keep in mind to give something back!
Now that we have a working connection to the API, I can describe the actual reimplementation.
Basic Setup
My reimplementation (which you can find here on GitHub) uses a slightly different tech stack than the original and replaces Svelte with Lit. I also used rollup for bundling.
While I am a huge fan of 11ty (and a contributer to the project), this time I left it aside, since we're only building one page and most of the content is loaded on the client anyways.
Sidenote on Lit:
If you haven't used it before, give it a try!
I personally do not like the syntax of JSX and the JS-native way of using template literals of Lit is just perfect for me.
So instead of
jsx<h1>Hello {name}</h1>
you'd write
jshtml`<h1>Hello ${this.name}!</h1>`;
and with the right plugins installed, you'll even have syntax highlighting.
If you now bundle that with the whole Lit package, you'll be writing native web-components reusable in all frameworks (conditions apply for React).
Start Fast...
To reduce the FCP time, I went a slightly different way than the original and extracted the App Shell into the index.html.
This means, that the first html I load already contains the header (including the logo, but not the search box) and the footer (which is completely static). That way I can push the render of the App Shell down to just 1.4 seconds (on a local deployment with simulated fast 3G - I expect this to be sub second on a real server). This is also not completely fair, because the App Shell is already rendered at this point, but FCP only triggers once the logo is rendered, which is slightly later.
...Optimize Loading...
Let's take a look at the new "Performance Insights" too:
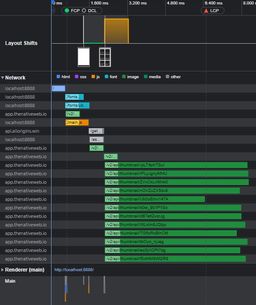
Loading Strategy
As you can see, I reduced the request rounds from 5 to 4 requests compared to the original and I also preloaded everything possible. For this reason the ubuntu font (which is used for the video titles) is already present when the first bunch of videos come in (normally a browser only starts loading a font when it's actually used, but we know that we will use it).
Also my JS bundle is just 28.7kb. This is possible, because Lit uses the platform as much as possible and I stripped out as much as I could leaving things like browser support on the line (but I think that even if you'd include reasonable support, the bundle should stay <100kb).
Payload Optimization
As I hinted to before, the original doesn't really compress and optimize the payload. Since I'm proxying the api requests through allorigins.win, which in turn uses Cloudflare, the API responses I receive are cached and compressed. So if I load the first videos twice, I get the response nearly instantly (since it's cached either on my device or on cloudflare) and even then the compressed size of the response is only about 24% of the original size. Because of that my API access on slow networks is significantly faster than in the original.
Avoiding Roundtrips...
Together with preloading things, I also just inlined the complete CSS (for the App Shell) into the HTML. That way I reduced the required roundtrips for rendering the App Shell by 1 and it can be rendered just with the HTML file (slight font jumping when they load included, but deemed acceptable).
The first-response trick doesn't work if the user starts searching for new videos before the first request finished, but I think this is okay here. It will fix itself once a request returned a total for all.
Also the original version downloads the total number of videos via a first request. This is all good, but the first video search is also for "all videos" and includes the total number of videos in the response. Since the backend is pretty fast and the roundtrip time on slow connection has a bigger performance hit, than it saves and the fact that the information is not that important, I decided to just pull that number from the first video response.
...and Reduce Bundle Size
Not only did I switch to Lit in my reimplementation to reduce bundle size (Lit is ~20kb uncompressed and 7kb compressed), but I also threw out datetime packages and similar stuff. Instead I used the platform native Intl.RelativeTimeFormat methods and used the normal Intersection Observers. Also (since it's so easy in this case) I didn't use any state management.
Yep, you read that right. No central state management. Everything is bundled in the components (wapp-search, wapp-videos and wapp-video).
But how does the wapp-videos component know which videos to display? - Simple: This is my complete(*) main.ts:
tsimport "./components/wapp-search.ts";
import "./components/wapp-videos.ts";
import WappVideos from "./components/wapp-videos.js";

const wappVideos = document.querySelector("wapp-videos") as WappVideos;
document
  .querySelector("wapp-search")
  .addEventListener("search", (e: CustomEvent) => {
    wappVideos.search = e.detail;
  });
As you can see, I just register an event handler on my custom element wapp-search for the "search" event and then pass that search via a property to the wapp-videos component.
(*) I removed the code for registering the service worker, but that's just the default one from MDN.
Images
A hinted to this earlier and now it's time for it.
Right now the original and my version use jpg images.
There is even more room for improvement by switching to webp or avif.
The original page currently only serves one version of the thumbnails and that at a fairly large 640x360px, which is nice on bigger screens, but most often the images are rendered at <350px, which is some good chunk of potential savings (which I'm willing to take here, but opinions might differ).
Right now I believe that the image API of "the native web" has its own image storage. (Update: After speaking to "the native web", they verified that I'm correct.) For my implementation I just skip that and use the YouTube image servers instead, since they allow for more image sizes and performance and we already have the YouTube ID of each video.
html<picture class="thumbnail">
  <source
    type="image/jpeg"
    media="(min-width: 400px)"
    srcset="https://i.ytimg.com/vi/${youTubeId}/hqdefault.jpg"
  />
  <source
    type="image/jpeg"
    srcset="https://i.ytimg.com/vi/${youTubeId}/mqdefault.jpg"
  />
  <img
    src="https://i.ytimg.com/vi/${youTubeId}/mqdefault.jpg"
    loading="lazy"
    decoding="async"
    alt="Thumbnail image for video ${title}"
    width="640"
    height="360"
  />
</picture>
With this change in place, we can half the size of the images down (even if the hq version is loaded) from ~1.1MB to 458kb (177kb if the mq version is used).
The Result
Demo Time
Always stay fair when hosting a reimplementation of something and add <meta name="robots" content="noindex"> to your HTML, so you don't compete with the original on SEO.
Bashing is easy, claiming to have done something is even easier, so let's proove it with a demo (the link is a standard Netlify link on purpose, so noone will try to keep it). If you want to take a look at the code, feel free to do so in the GitHub repository. Please keep in mind that this is just a demo and the code is not at all "production ready".
"The native web" was nice enough to allow me to host my results as an adapted demo (the screenshots below show a 1:1 replication, while the linked demo shows an adapted version to avoid trademark problems).
And now, let's start with a comparison of the two pages:
Original
Reimplementation
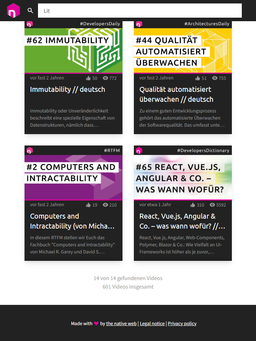
One design change I did, was increasing the contrast ration to fit into AAA contrast on the "14 von 14 gefundene Videos" so the a11y score gets to 100.
Speaking of Scores
These are the new scores:

Still Open Options
Font Embedding
It's possible to embed fonts directly in the CSS like Squoosh does. This would require the extra work of subsetting the font to not make it bigger than before and in this case I think the benefit will be zero at best.
Image Formats
Like mentioned before, switching to modern image formats like webp, avif or jpegxl might improve the situation further.
Prerendering
If we not only embed the App Shell in the HTML, but instead the first twelve videos (which are always open on page load), we could improve performance even further at the cost of rebuilding the page every time a video is published.
What I learned
Obviously I didn't do this just to show off, but to actually learn something, so what did we learn?
-webkit-line-clamp
I never knew such a thing existed and even less so would I've tried using it even if I saw it somewhere.
This little piece of tech is just great.
At first sight I thought this was just a WebKit thing, but no! It's actually part of the standard and browser support is great too.
Just apply this CSS to any element with a bunch of text:
css.class {
  overflow: hidden;
  display: -webkit-box;
  -webkit-box-orient: vertical;
  -webkit-line-clamp: var(--number-of-lines);
}
Interactive Demo
I chose part of the german fairy tale "Hänsel and Gretel" as an example text. Yeah, we germans have a weird way to teach our children (Wikipedia plot for reference).
Never trust your own machine
Like the performance metrics showed in the first update, you shouldn't run your tests only on one machine and/or internet connection.
While this doesn't really impact the validity of the methods outlined in this post, it has an impact on the necessity. A performance score of 50 is something to improve upon, a score of 77 is often fine.
Disagree and cooperate
During my interactions with Golo Roden we had some different opinions and starting points. I believe that one should strive for as open APIs as your usecases allow, he had the completely valid opinion that you only need to look at your own usecases and not possible third party ones when your API isn't meant for external use. For me the obvious way of running lighthouse tests was mobile, his was desktop which led to some confusion over my results. Again, both points of view are completely valid, you just need to agree on the settings when comparing results. From their point of view desktop as the default makes sense, since they know that most of their users are on desktop anyway. I personally think that you should test on mobile anyway, since those results tend to be worse and therefore give you a stricter performance target to hit, which benefits all users.
Even though we disagreed on those details, we never stopped cooperating on the topics at hand, trying to understand each other. This cooperation led to an improvement in their site and this blog article.
A special thanks to...
By the way, did you notice that this post uses the pink from "the native web"'s design scheme?
If you read my blog more often, you know that blog posts normally have another color.
"The native web" for letting me use their site for a blog post and especially to Golo Roden for the nice communications while writing this blog post. I don't take it for granted, that you reacted to this in such a positive manner.
For obvious reasons I don't put the code on GitHub under my normal permissive license, since it includes IP of "the native web".
So there's only one thing left to say:
Made with for the native web
Update Log
I will add here any updates "the native web" does to their site and what the impact to this article is.
2022-10-20: Bundle Size
I saw that my local test scores are significantly worse than with a neutral test at pagespeed.web.dev. This means, that the numbers mentioned in this article are probably worse than they should be. This has no impact on the improvements discussed in this post, but should be noted.
Golo Roden confirmed that the 1.2MB page.svelte was an issue with an incorrect import. This happens to all of us and is an easy mistake to make. In this special case the datetime library included all possible translations. Removing those reduces the page.svelte from 1.2MB to just 32.9kb and the whole JS bundle now weighs in with only 85.8kb - this is far below my normal 100kb of JS line and therefore is a brilliant result (and also closer to what I expected from Svelte).
This massively improves the loading graph:
The long horizontal lines are gone! (It could still be better, but this is more than acceptable)
To make this more clear, let's take a look at the new lighthouse scores (on mobile):
On Desktop the performance increased to over 90, which is a green score even for lighthouse.
Also on PageSpeed Insights the mobile score is 77, which is significantly higher.
I mentioned this issue in a comment above, but I can't test the old version for comparison, so I'll stick to my local measurements.
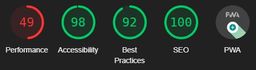
This is much better. The "Performance" metrics saw an improvement of more than 50% (32 increased to 49 - keep in mind, this value is on a log scale).
2022-10-22 Demo incoming
Communication is key
Yesterday I hat a video call with "the native web" where we discussed the issues mentioned in this post and they already implemented some and also gave me approval for hosting a demo of me reimplementation, so you can take a look at it yourself.
Fixes to the original
They also looked at implementing the will-change: transform; property mentioned above, but since it's slightly blurring text outside of animations, they've decided against it.
Even better, they've fixed their aspect ratio issues (lighthouse still reports one with the logo, but that's a false-positive, since SVGs scale correctly).
Looking forward
From now on I won't guarantee that I will always update the post on time when "the native web" does an update. But there might be something coming from their side because of this post... (If you're in the future, you might have already seen it) I will post an update once something happens.
2023-01-30: Final Update
It's now been 3 months since I first published this blogpost. Right after publishing it (and while I was talking to Golo), they asked if they could create a video based on my analysis, but some time later they admitted, that they didn't find the "right words" to give their perspective, so they gave me an invite:
A couple of days ago I joined Golo in his livestream and we spend close to four hours talking about this blogpost and general performance tipps. It was a lot of fun and a special thanks goes out to the awesome community which was integral to the success of the stream by providing input and questions.
For everyone who understands german I highly recommend giving it a look, especially around the 3 hour mark, where we finished the "retelling" of this blogpost and started more of a "performance smalltalk".
After the livestream I consider this blogpost done and probably won't update it anymore. Nonetheless I will still keep writing, so it might be worth it to still follow me on here or one of my social links in the footer.
I want to make the following clear beforehand:
I personally really like the content "the native web" produces, and I recommend their YouTube channel quite frequently to other developers looking for good, german resources about web and cloud related topics.
Also while this blog post focuses heavily on performance and discovers some heavy improvements in this regard, performance is not everything and as I show it takes quite a lot of work to do correctly.
I also believe that the discussed page does not provide a representative view on their "normal" work and if you think about hiring them, see this post as a love letter to them and not a reason not to work with them. I'm not discussing their page here because it's bad (it isn't), but because they are a public figure and I enjoy their content. And since they're web developers, my natural instinct of running lighthouse took over and I saw some options to improve it.
Also to my knowledge this is "the native web" experimenting with new (and old) technologies and therefore it's an easy target (noone is judging you on your first water colors painting).